
We advise and implement
We don't stop at the diagnostic. We design the solution and build it into your operation.

Assistants and automations, websites, robotics and custom software. We work out where technology pays off in your business, build the solution, and keep it running.
Four lines of work, one team. We start with the diagnostic and implement what actually fits your case.
Real projects in SMEs: AI and automation, websites, robotics and custom software. Each one solved a concrete productivity or business problem.
Enbiente wanted to use technology the way it recommends to clients. We built AI automations that free people from repetitive work: email triage, a customer-service chatbot, quotes, attendance, ERP product creation, contact cleaning and enrichment, and data-driven upsell.
See detail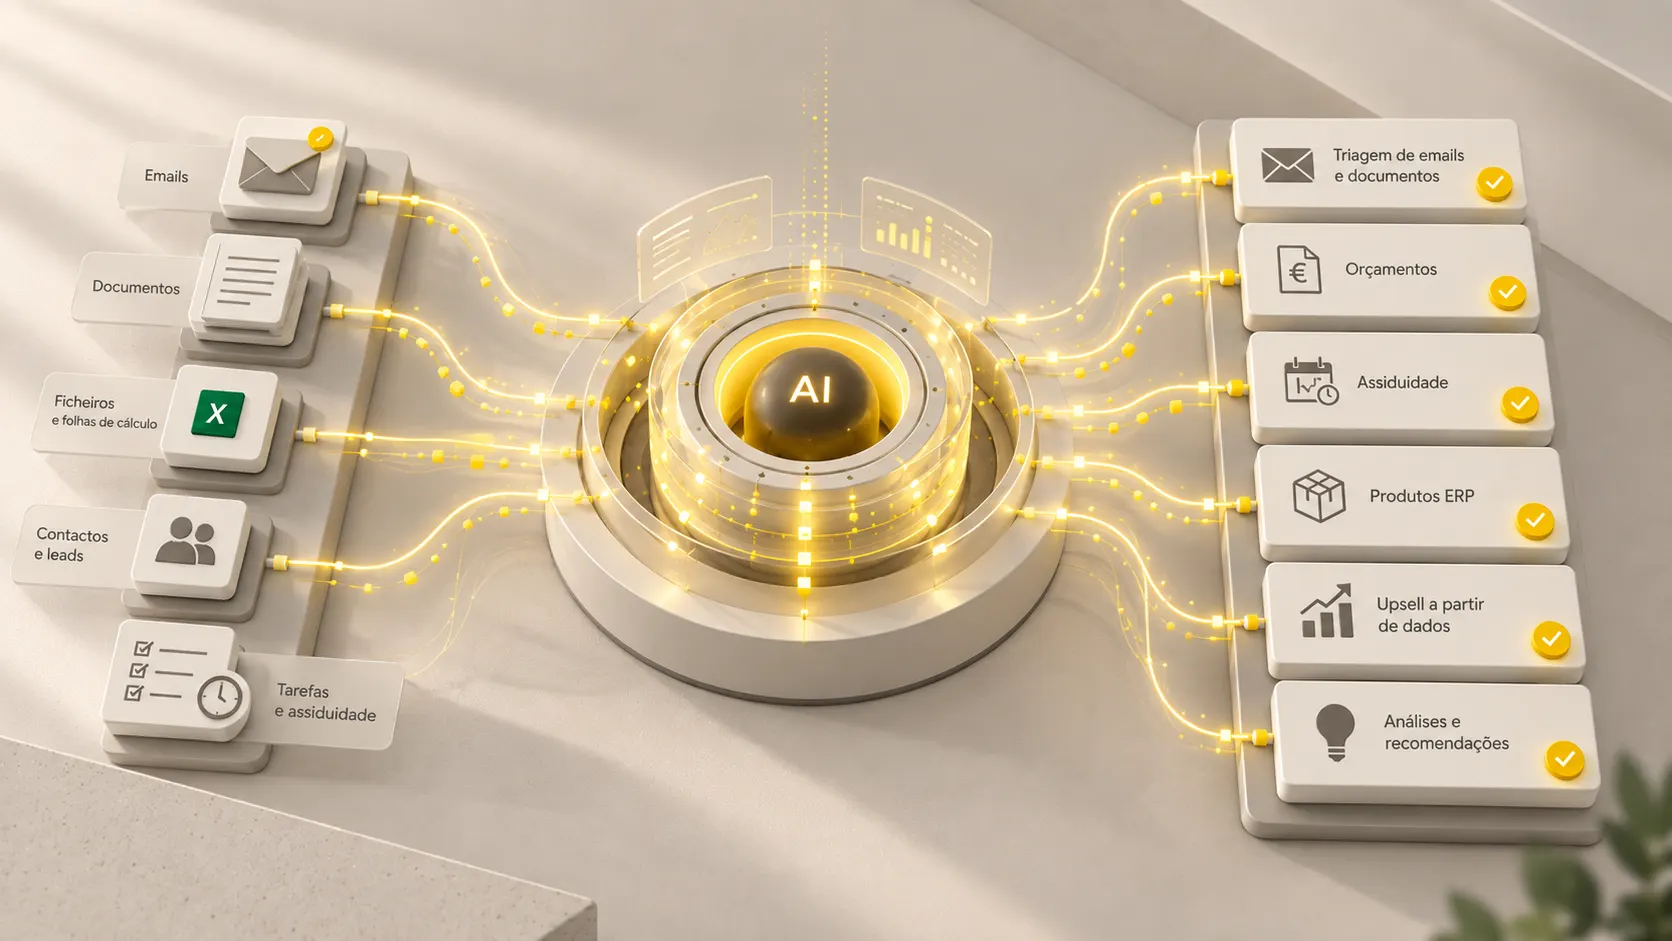
We swapped Enbiente's Magento site, locked to a template, for a website of our own: bespoke, fast and with direct integrations. Enquiries now arrive almost three times faster.
See detail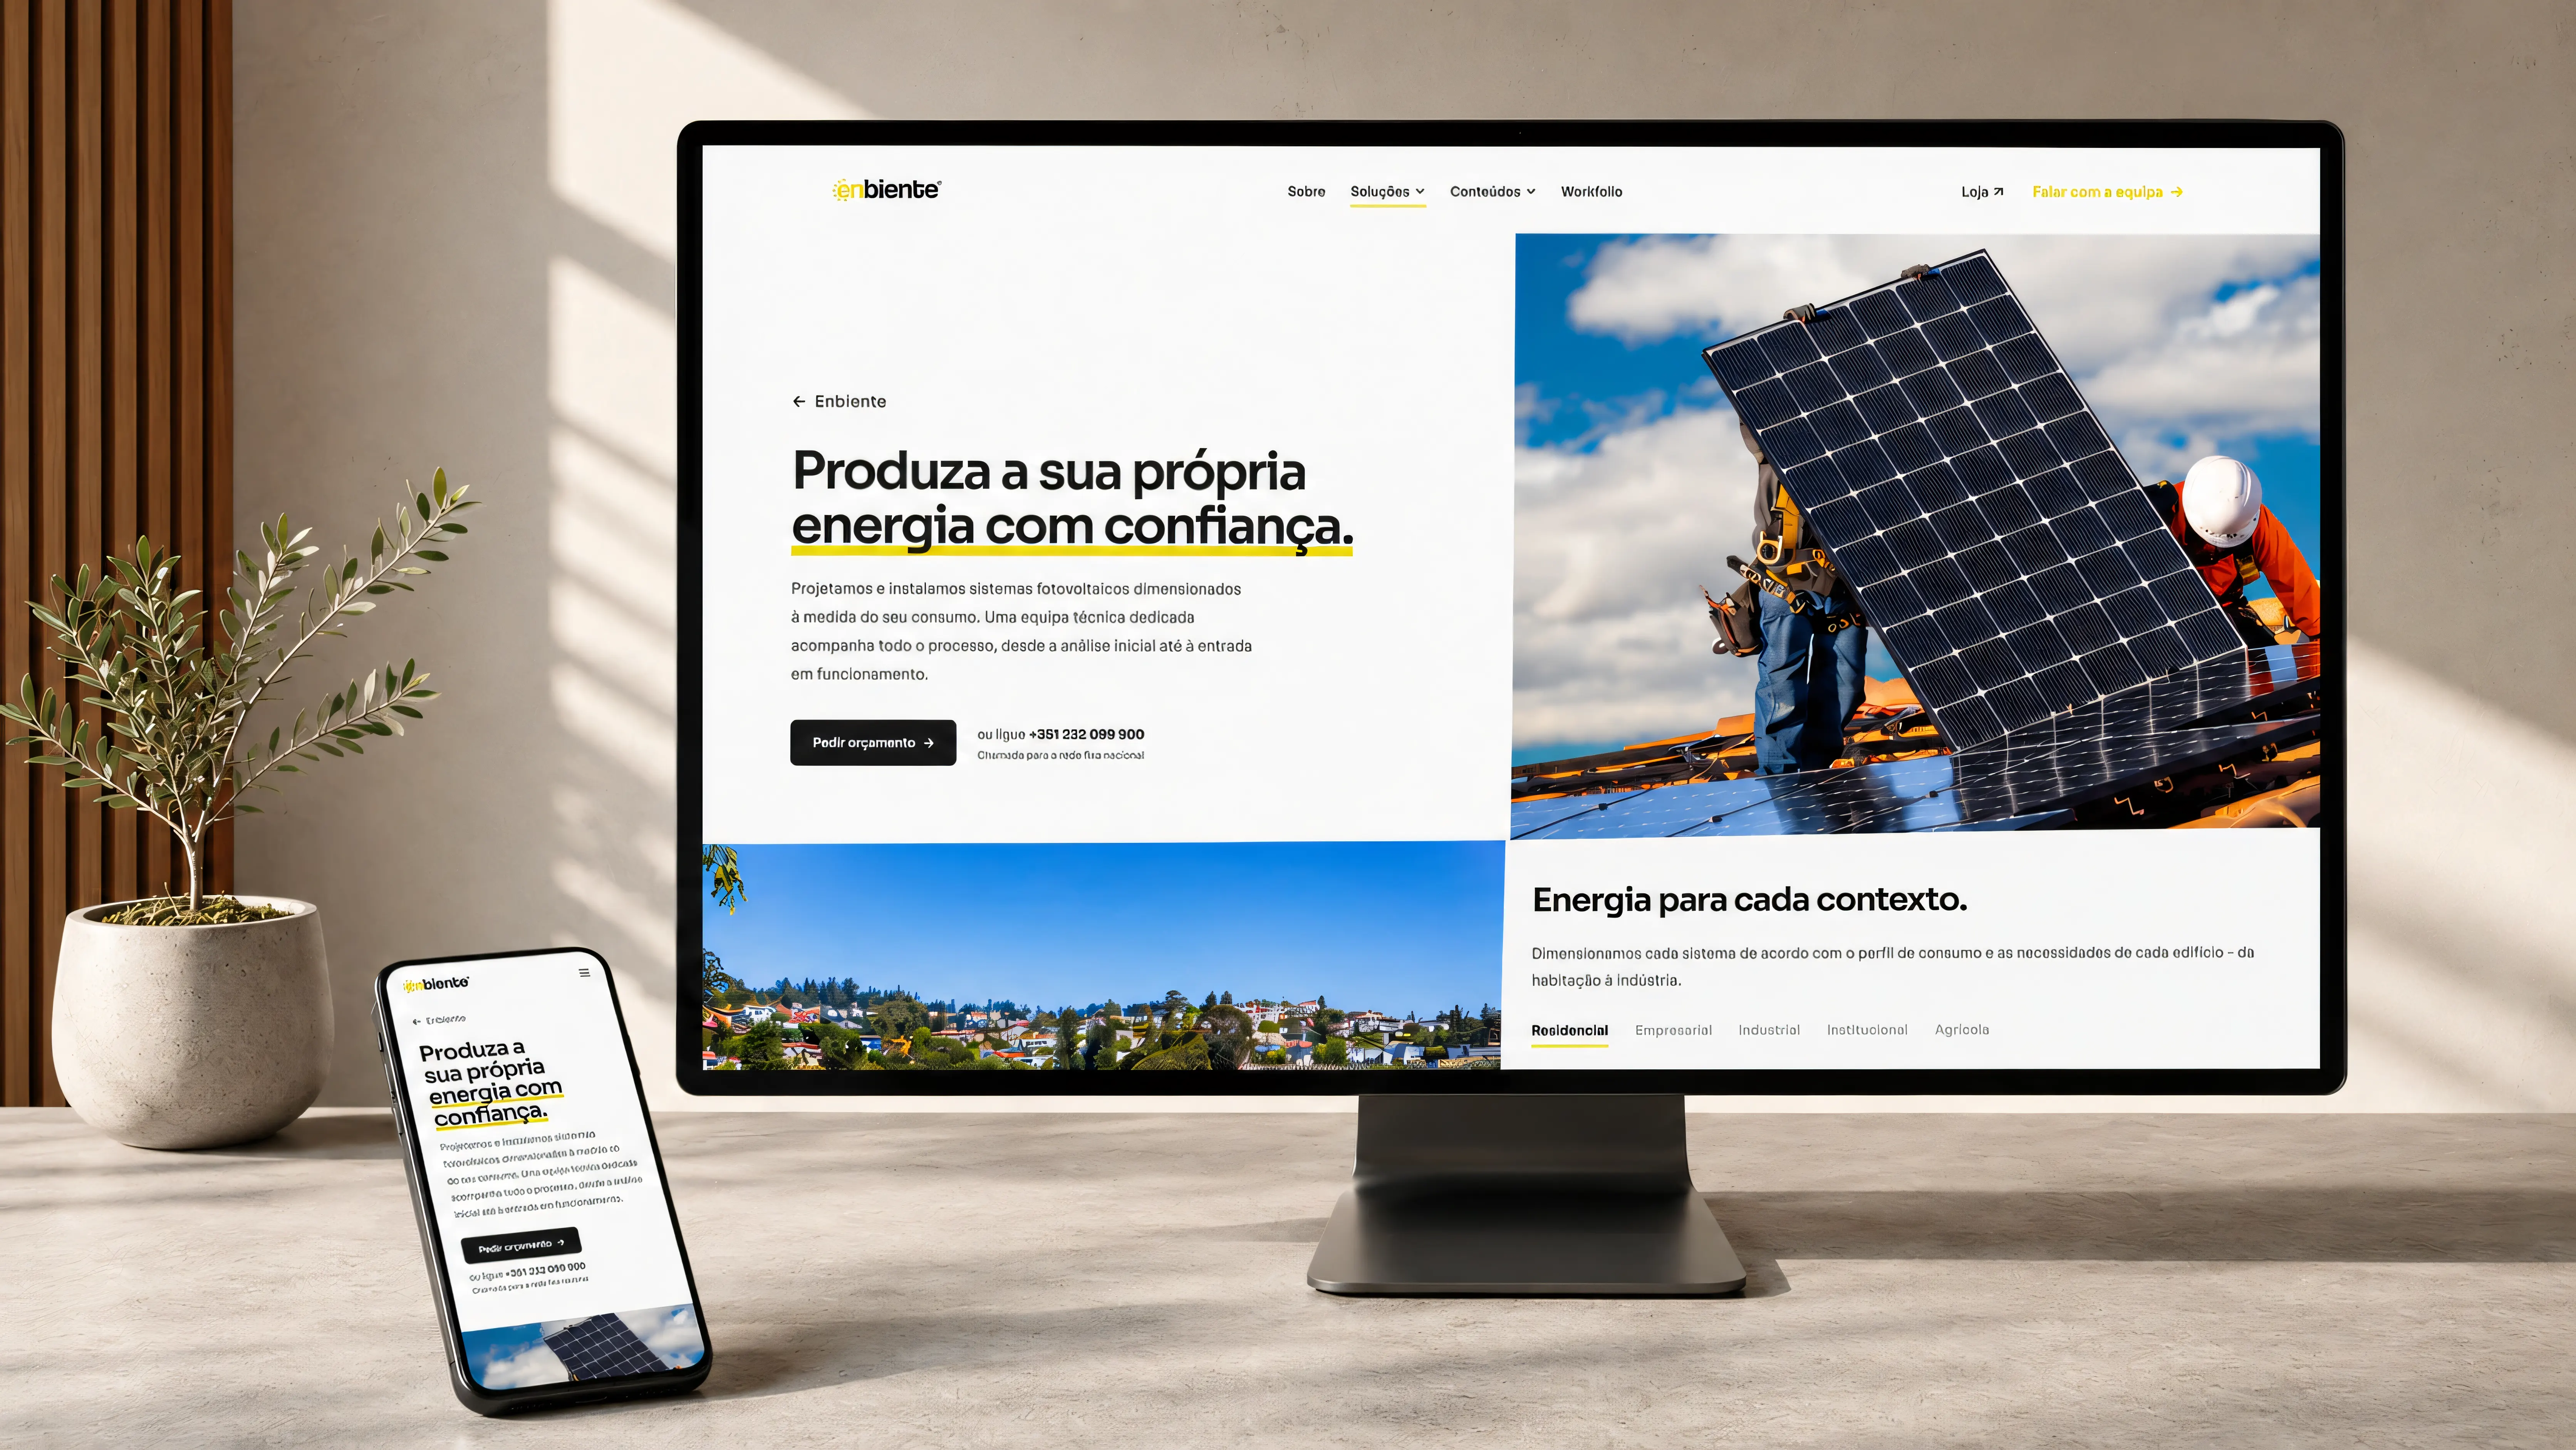
Universidade Politécnica de Viseu's Department of Electrical Engineering welcomed nearly a thousand visitors and dozens of stands at its DEE Open Day. We built a real-time web app, shared by QR code, that let each group reserve stands, see which were free, and know where to go next, with no waiting.
See detail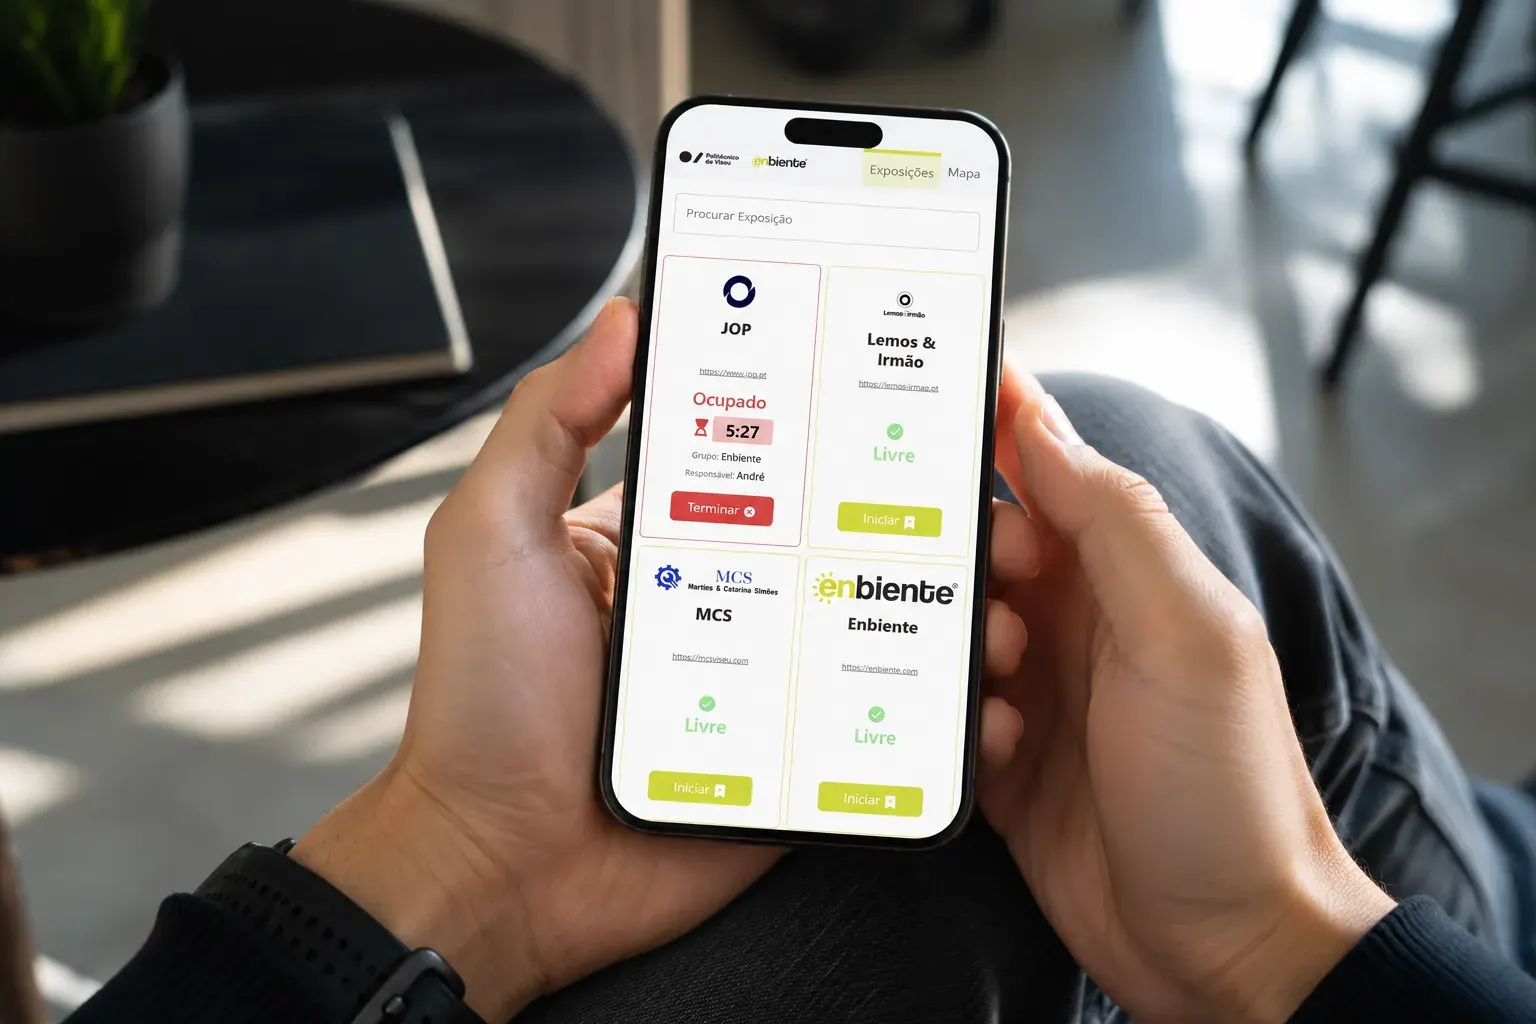
Research, development and the business community of the Viseu region.




A technical team that advises and implements, with no overselling and no empty promises.
We don't stop at the diagnostic. We design the solution and build it into your operation.
The people you talk to are the ones who understand the technology and make it work.
The people automating your operation understand the process, and can talk to the other trades.
We don't vanish at launch. We measure, adjust and improve, so the solution keeps working in your operation long term.
We don't sell slideware. We work out where technology pays off in your company, choose the right approach, and implement it in your processes.
We understand your business and map where technology returns the most.
We choose the right tools and approach for your processes and budget.
We build and integrate the solution into your operation, without disrupting the day-to-day.
We monitor, measure and improve: building well is an ongoing process, not a one-off project.
There are public support lines that can co-fund AI adoption in your company, such as the “IA nas PME” line. We don't handle the applications, but we help you develop and implement the solutions you want.
Indicative figures: calls and deadlines change over time. We don't handle applications and we're not a funding intermediary.
The questions SMEs usually ask us before getting started.
Probably not. Most AI and automation tools are now within reach of micro and small businesses, and the same goes for a website or a leased service robot. What changes is the scale: we start with what returns quickly for little investment.
No. AI and automation are our lead line, but we also build websites and web apps, put robots to work in the operation, and develop custom software and firmware. The diagnostic decides which of those actually solves your problem.
It depends on the problem and the solution. The diagnostic exists precisely to size that with you, with a clear estimate before you commit. The first conversation carries no obligation.
No. enbia is consulting and implementation; we are not a funding intermediary and don't handle applications. We help you understand whether your investment may fit support such as "IA nas PME", but confirm the terms and deadlines with the responsible bodies.
Many automations go into production within a few weeks. We prefer to start with a concrete, visible-return use case and expand from there.
Rarely. Wherever possible we integrate with what you already have (email, ERP, spreadsheets, CRM). The diagnostic maps what makes sense to keep, integrate or replace.
We take it seriously. We choose tools and configurations suited to your company's data and legal context, and we discuss those options with you before implementing.
A short conversation where we work out how you operate today, where time is being lost and what systems you already run. You leave knowing what would make sense to implement first and roughly what it would cost, even if you decide not to go ahead with us.
A short conversation to see where technology delivers the most for your business and what would make sense to implement first.


